Publisher description
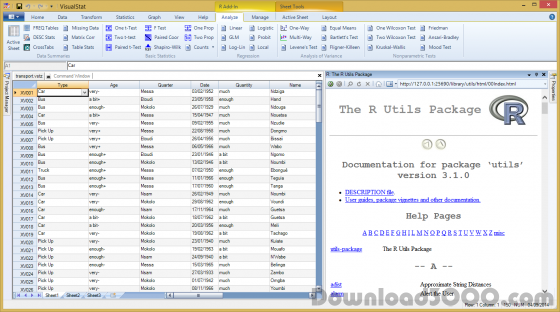
VisualStat is a comprehensive and versatile desktop statistics package that is simple for beginners, yet powerful enough for experts. It incorporates all the descriptive statistics, parametric and nonparametric statistical methods, charts and data transforms you will need for processing, analyzing and presenting data. All test results have an associated report which provides a short conclusion and other descriptions to assist in the interpretation. VisualStat is a major integrated development environment for R, allowing users to run R scripts and commands directly inside VisualStat. R output can be retrieved as native VisualStat output, and managed via highly flexible VisualStat containers. All VisualStat DataBook are manipulated as the R DataFrame, without any import/export procedure. Provides a platform-independent basic-statistics GUI (graphical user interface) for R, based on the many package. Statistical features: Basic statistics: Univariate stat, Frequencies, CrossTabs, T-Test,Fisher F-test Chi-square: odds ratio, Pearson, Bowker, McNemar, Likelihood-Ratio, Mantel-Haenszel, GOF Exact Tests: Binomial, Proportions, Fisher, Sign test Parametric Methods: t-Tests, Z tests, Sign test, F test, Shapiro-Wilk, Shapiro-Francia Regression: Linear, polynomial, logistic, stepwise, Cox, Kendall, Spearman, residual, GLM ANOVA: MANOVA, Analysis of means, Multiple comparisons - Tukey, Dunnett, Scheffé, Bonferroni Non-parametric: Mann-Whitney, Kolmogorov-Smirnov, Kruskal-Wallis, Wilcoxon, Friedman Multivariate: PCA, Cluster analysis, Correspondence analysis, Biplot for PCA & MCA Spreadsheet features: Reads Excel-SPSS-MiniTab-Stata, Query databases with ODBC, DataBook, multiple sheets, Formulas, multiple columns/rows headers, Auto DragAndDrop Data manipulation: merge, subset, sort, transpose, split, stack, unstack, recode Charts: histograms, Bar, Pie, Line, HiLo, Candle, Polar, Error, Box-and-Whisker Export in many file formats, including jpg, bmp, emf, png
Related Programs
ESBStats - Statistical Analysis Software 2.2.0
Statistical Analysis made easy

Web Power Data Mining 2.1.6
Automate searching & extracting data from WWW
Regression Analysis and Forecasting 3.2
Multiple Regression Analysis and Forecasting.
Regression analysis - CurveFitter 4.5.24
CurveFitter performs regression analysis
Regression Analysis - DataFitting 1.7.24
DataFitting performs regression analysis